Contents
Searching
There are two ways to search the data on the "Spinal Cord " site; "Gene Search" and "Advanced Search."
Gene Search
"Gene Search" appears on our landing page. A gene search will show you a list of all the experiments we've done involving a gene that matches your search criteria. A "Match" in gene search means that the text you type in is contained somewhere in the name, symbol or alternate symbol of the gene involved in the experiment.As you begin typing in the gene search box, a list of suggestions will appear. You can use your arrow keys or the mouse to move down, highlighting the desired entry. If you're using your mouse, click on the desired entry to select it, then hit your "Enter" key or click the Search button to perform the search. If you're using arrow keys, hit the "Enter" or "Tab" key to select the highlighted item. If you don't want to use any of the suggestions, hit your "Esc" key or click your mouse outside the list and it will disappear.
Advanced Search
The Advanced Search page has many more options. You can:- Use the check boxes to limit a gene search to any combination of gene name, symbol or alternate symbols.
- Search by EntrezGene ID, or by our internal Image Series ID.
- Search by specimen age.
Type-ahead suggestions will appear for the gene search and all of the ID entry fields. After selecting a suggestion, click the Search button or hit the Enter key to perform your search. As noted above, you can dismiss the list of suggestions by hitting the "Esc" key.
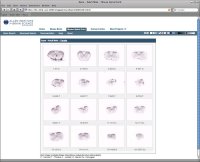
Search Results
The result set shows a collection of gene expression experiments.Please note-- If you searched by gene, it may appear that some of the rows do not match your gene criteria. Keep in mind that by default all of the alternate gene symbols (which are not shown in the result list) are included in a gene search. To see the alternate symbols for a gene, click on the gene symbol in the result list. If you want to exclude alternate symbols from your gene search, try the Advanced Search page.
Expression charts
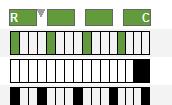 Each of our experiments is divided into 16 images, covering the length of the spinal cord.
Each row in the result set contains a small expression chart that describes in which images
expression was detected for the given gene. As shown in the example at left, each chart is
divided into 16 bars, one for each image in the image series. If expression was detected
in an image, its corresponding bar will be colored green. If no expression was detected,
the bar will be colored white. If a section image is
unavailable, its position will be colored black. The sections progress from rostral to caudal,
reading left to right.
Each of our experiments is divided into 16 images, covering the length of the spinal cord.
Each row in the result set contains a small expression chart that describes in which images
expression was detected for the given gene. As shown in the example at left, each chart is
divided into 16 bars, one for each image in the image series. If expression was detected
in an image, its corresponding bar will be colored green. If no expression was detected,
the bar will be colored white. If a section image is
unavailable, its position will be colored black. The sections progress from rostral to caudal,
reading left to right.
Expression Categories
This chart appears on the search results page and is meant to indicate membership in the various "expression enrichment" categories for each experiment.
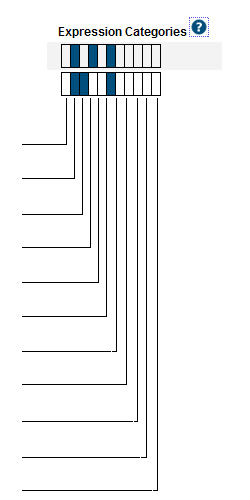 A dark blue rectangle indicates membership in the corresponding category.
The category positions are described below; you can also hover your mouse
over a blue rectangle to show the category name.
A dark blue rectangle indicates membership in the corresponding category.
The category positions are described below; you can also hover your mouse
over a blue rectangle to show the category name.
- Laminae 1-3
- Laminae 4-6
- Laminae 7-8
- Laminae 9
- Intermediolateral Column
- Gray Matter
- White Matter
- Central Canal
- Ventral-dorsal Midline in Gray Matter
- Radially Arrayed in White Matter
- Vascular-like in Gray and White Matter
Sorting
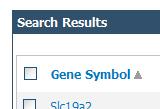 The results are initially sorted by
Gene Symbol in ascending order. Click on any of the column headers to sort by that column; click on the
same column header again to reverse the sort order. A small arrow will appear next to the currently sorted
column, indicating the sort order, as shown in the image at right.
It is also possible to sort by expression position. In the expression chart illustration above,
note the rectangular green blocks in the top row. Clicking one of these boxes will sort the results
according to amount of expression in the corresponding area of the specimen. Each of the sort-boxes
represents an area covering four images in the specimen. The first box (labeled "R" for Rostral) represents
the four most-rostral images; the last box (labeled "C" for caudal) represents the four most-caudal
images, and so on.
The results are initially sorted by
Gene Symbol in ascending order. Click on any of the column headers to sort by that column; click on the
same column header again to reverse the sort order. A small arrow will appear next to the currently sorted
column, indicating the sort order, as shown in the image at right.
It is also possible to sort by expression position. In the expression chart illustration above,
note the rectangular green blocks in the top row. Clicking one of these boxes will sort the results
according to amount of expression in the corresponding area of the specimen. Each of the sort-boxes
represents an area covering four images in the specimen. The first box (labeled "R" for Rostral) represents
the four most-rostral images; the last box (labeled "C" for caudal) represents the four most-caudal
images, and so on.
Getting more detailed information
The Gene Symbol links to detailed information about the gene in our experiments. The number in the "Images" column links directly to a contact sheet of all the images for the given experiment.Comparing Result Sets
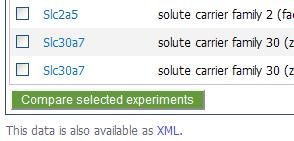 In addition to the links found
in each experiment row, you can select multiple rows to compare side-by-side. Click the check box at
the far left of the desired rows, then click the "Compare Selected Experiments" button. Use the check box
in the column header to toggle all of the row check boxes on or off.
In addition to the links found
in each experiment row, you can select multiple rows to compare side-by-side. Click the check box at
the far left of the desired rows, then click the "Compare Selected Experiments" button. Use the check box
in the column header to toggle all of the row check boxes on or off.
XML
As shown in the image above, at the bottom of the table there is a link to an XML document containing all of the data in the result set.
Image Series Detail
Gene Symbol
This section shows some gene metadata, including any alternate names for the given gene. If we have data on the same gene in the Allen Brain Atlas project, a link will be included here. If there is a homologue for the current gene in humans and we have data on it in the Human Cortex project of the Allen Institute, a link will be included in this section.Expression Info
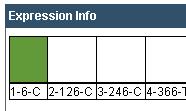
The colored bars in the Expression Info area are a more detailed version of the expression chart from the search result page, as described above. As in the smaller version of the chart, bars are colored green where expression was detected in the corresponding image and white where expression was not detected. There will always be 16 bars in the chart; in cases where an image is not available, the bar will be colored black.
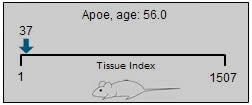
In this detailed view, each bar in the chart is labeled with the image index, tissue index, & annotated segment abbreviation (if available.) The image index refers to the position of the image relative to the image series; these will range from 1 to 16. The tissue index refers to the position of the section relative to the specimen as a whole.
External Resources
The External Resources section contains links to other organizations that provide gene expression data. These links open in a new browser window, and should show information related to the current gene.
Image Detail Page
The image detail page displays the ISH images from one or more image series. A number
of different display and formatting options are described below. Use the layout buttons
 located on the page toolbar
to switch between the various layout options.
located on the page toolbar
to switch between the various layout options.
Using the Zoom and Pan (Zap) Image Viewer
The default layout shows one or more zoom-and-pan (zap) viewers. The zap viewer allows you to navigate through an image series' thumbnails to select an image to view at higher resolution. Once selected, you can use your mouse or keyboard to zoom and pan the larger image. Additional image manipulation tools are described below.
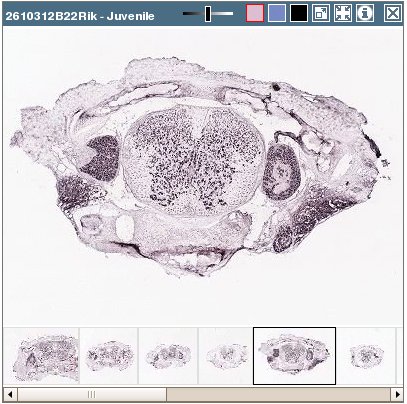
Image Manipulation
Select a thumbnail from the bottom of the image series' window to open its image in the viewer window. Drag the image with your mouse pointer to an area of interest, then use the plus (+) and minus (-) keys or the wheel on your mouse to zoom in and out.
 |
Move the slider bar to the left to intensify the contrast or color. |


|
Select ISH, Nissl or expression mask image type. |
 |
Open the selected image in a high-resolution viewer in a new browser window. |
 |
Synchronize the images in other viewers on the page to the currently selected image. Only images from specimens of the same age will be synchronized. |
 |
Open a new browser window to review metadata for the image series. |
 |
Close the viewer. |
Multiple image series can be opened on the same Web page to enable side-by-side comparisons. You can swap viewers' positions on the page by clicking on the first viewer's title bar and dragging it to the second viewer's position.
Alternative Layouts
The layout buttons on the image control toolbar can be used to switch between the
contact sheet & row-based views.
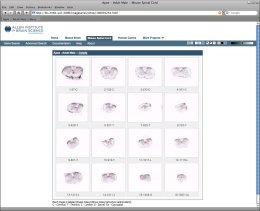
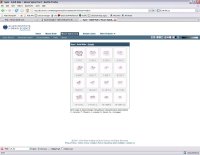
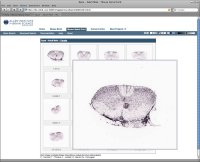
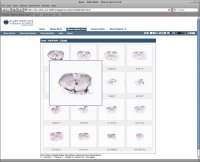
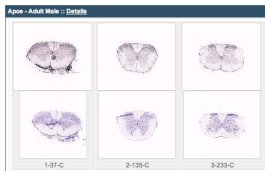
 The contact sheet layout for a single image series looks like the image to the left.
Images are arranged in four rows of four. This view is probably most useful for a single
image series.
The contact sheet layout for a single image series looks like the image to the left.
Images are arranged in four rows of four. This view is probably most useful for a single
image series.
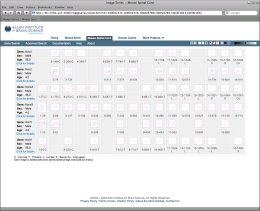
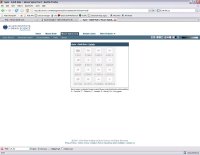
Multiple image series will be shown in a row-based layout, as shown at right. This view allows all the images from a large number of image series to be visible at one time.
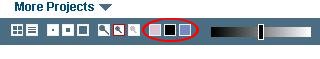
Size
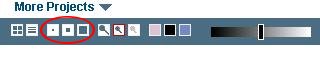 The sizing buttons on the toolbar can be used to change the size of the thumbnails.
By default, the largest thumbnail size is used when viewing a single image series. When multiple series are compared, a smaller thumbnail size will be used. You can override these default values by using the image sizing buttons on the toolbar.
Magnifier
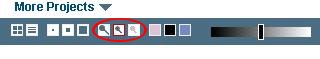 As you move your mouse over each thumbnail, a magnified version of the image will pop up.
Use the magnifier buttons to set the size of the magnified image, or
disable the magnifier. The currently selected magnifier button will be highlighted
with a red border.
As you move your mouse over each thumbnail, a magnified version of the image will pop up.
Use the magnifier buttons to set the size of the magnified image, or
disable the magnifier. The currently selected magnifier button will be highlighted
with a red border.
 To the right are examples of the small & large magnifiers in use.
Clicking on any of the thumbnails will launch a high resolution viewer for that image in a new browser window. See the Single Image Viewer section below for details on working in that view.
Image Type
 There are two related images available for each ISH thumbnail:
- The enhanced expression mask. This image is constructed from the signal detected by our image analysis algorithms. This is a grayscale image where the lighter areas indicate stronger signal. Due to the generally low signal, we are showing by default an enhanced version of the expression mask. The bright points in the image have been enlarged and brightened further to make expression more easily discernable in the small thumbnail images presented here. NOTE that clicking on the expression mask thumbnails will open the image in a high resolution image viewer. The expression mask image is not enhanced in the high resolution viewer.
- The closest Nissl stained section. Every tenth section is Nissl stained.
)
will swap out the ISH image and swap in the expression mask image. To return to the
ISH image, click on the ISH ()
button.
)
will toggle the display of the nearest Nissl image for each thumbnail. The Nissl
image will be displayed beneath its corresponding thumbnail, as shown at left. The nearest
Nissl image is available whether the ISH or expression mask thumbnail is currently being shown.
Contrast/Brightness
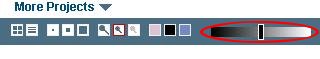 Use the slider control on the toolbar to increase or decrease the contrast
and brightness of the thumbnails. Changing this setting will affect both ISH
& expression mask thumbnails, but not Nissl images.
Use the slider control on the toolbar to increase or decrease the contrast
and brightness of the thumbnails. Changing this setting will affect both ISH
& expression mask thumbnails, but not Nissl images.
The center position is "neutral," that is, no enhancement is applied to the images. Moving the slider to the left will darken the images, moving to the right of center will brighten them. To reset the slider to its default position for the type of image currently being displayed, click on the corresponding Image Type button.
The default position for ISH images is "neutral", while the default position for expression mask images is about +80% brightness.
High Resolution Image Viewer
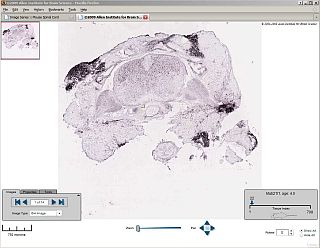 Click on any thumbnail image in this application to launch the high resolution viewer
in a new browser window. This viewer provides an efficient way of viewing very large,
high resolution images over relatively low bandwidth.
Click on any thumbnail image in this application to launch the high resolution viewer
in a new browser window. This viewer provides an efficient way of viewing very large,
high resolution images over relatively low bandwidth.
 Use the controls shown at left to zoom and pan around the image. You can also zoom
by clicking on the image, and pan by click-and-dragging the image, or using the
keyboard up/down/right/left arrow keys.
Use the controls shown at left to zoom and pan around the image. You can also zoom
by clicking on the image, and pan by click-and-dragging the image, or using the
keyboard up/down/right/left arrow keys.
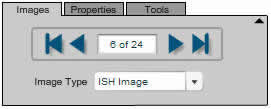 The tool box shown at right enables you to
- Switch between an ISH image and its corresponding expression mask or closest Nissl image.
- Page through all the images in the same image series.
- Adjust contrast & brightness (on the "Properties" page.)
- Email a link to the image (Tools page.)
- Download a JPEG of the image (Tools page.)
Note: all downloaded images will have rotation of 0 degrees
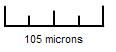 The scale key will change appropriately as you zoom in and out of the image. Click
and drag the key to any position on the image to measure regions of interest.
Click on the text to flip the scale from horizontal to vertical.
The scale key will change appropriately as you zoom in and out of the image. Click
and drag the key to any position on the image to measure regions of interest.
Click on the text to flip the scale from horizontal to vertical.
 The position key shows approximately where the current section comes from, relative to the
specimen as a whole.
The position key shows approximately where the current section comes from, relative to the
specimen as a whole.
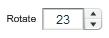 The rotate control allows you to rotate the image to manipulate viewing orientation. Please note that
if you download a JPEG of the image (see tool box description above), the image will not have
any rotation applied to it; it will have a rotation of 0 degrees.
The rotate control allows you to rotate the image to manipulate viewing orientation. Please note that
if you download a JPEG of the image (see tool box description above), the image will not have
any rotation applied to it; it will have a rotation of 0 degrees.
Expression Mask Color Maps
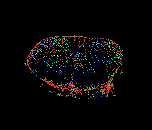 The expression mask images you see on this site start out as gray scale images, with low expression appearing
as black, and increasingly high expression showing as increasingly bright white. By default, we apply a color
map to make the difference between high and low expression more distinct.
On
the color map page
, you can choose how colors are mapped to expression masks. Your choice is stored in a javascript cookie on
your computer. This means that your choice will stay in effect until either you return to the color map page
to change it, or the cookie is deleted from your computer. It also means that your web browser must be
configured to accept cookies, which is already the case for the great majority of users
The expression mask images you see on this site start out as gray scale images, with low expression appearing
as black, and increasingly high expression showing as increasingly bright white. By default, we apply a color
map to make the difference between high and low expression more distinct.
On
the color map page
, you can choose how colors are mapped to expression masks. Your choice is stored in a javascript cookie on
your computer. This means that your choice will stay in effect until either you return to the color map page
to change it, or the cookie is deleted from your computer. It also means that your web browser must be
configured to accept cookies, which is already the case for the great majority of users
Click here to go to the expression mask color map page.